
Want to get more out of SuiteAcademy?
Become a member and get access to:
- Workshops
- Courses
- Templates
- Monthly progress calls
Are you having trouble making sense of your SuiteCRM data? Want to create reports that give you valuable insights into your business performance? Well, you’re in the right place. Welcome to SuiteCRM Reporting 101!
In this beginner’s guide, I’ll take you through the basics of SuiteCRM reporting and show you how to create reports that will help you make data-driven decisions. If you’re just getting started, this video is perfect for you to master the SuiteCRM Report Basics.
First things first, make sure your SuiteCRM system is up and running, with your data in place. The best part about SuiteCRM Reports is that they are super user-friendly, offering a ton of functionality right out of the box.
By the end of this guide, you’ll have a solid understanding of the fundamentals of SuiteCRM reporting, and you’ll be able to create reports that help you make data-driven decisions. So, let’s get started!
Create a Report
Create a Report: Mastering the SuiteCRM Report Basics
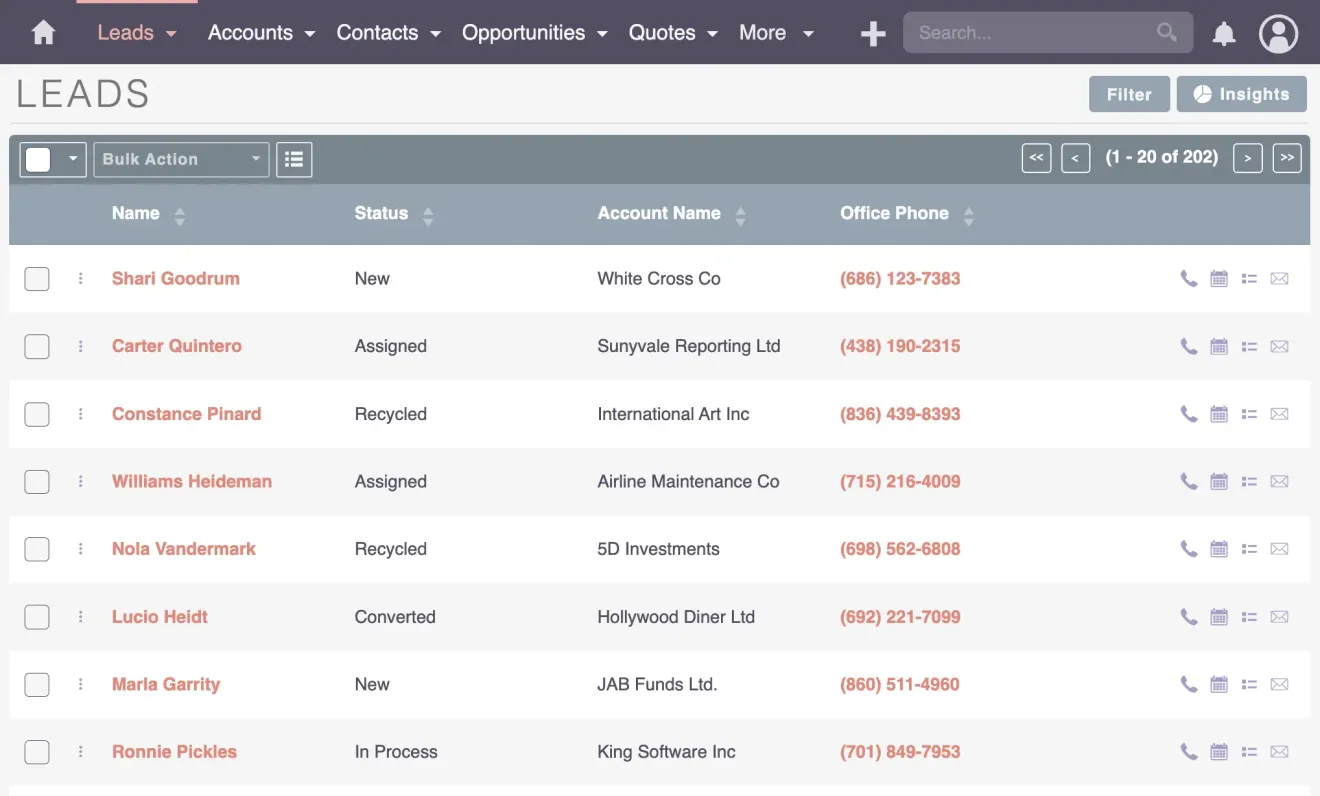
First, navigate to the Leads module. If you have demo data, that’s great – if you have your real data, even better!
Head over to the Reports module using a second tab, and since there are no reports initially, your task is to find the right data and answer pertinent questions with your reports.
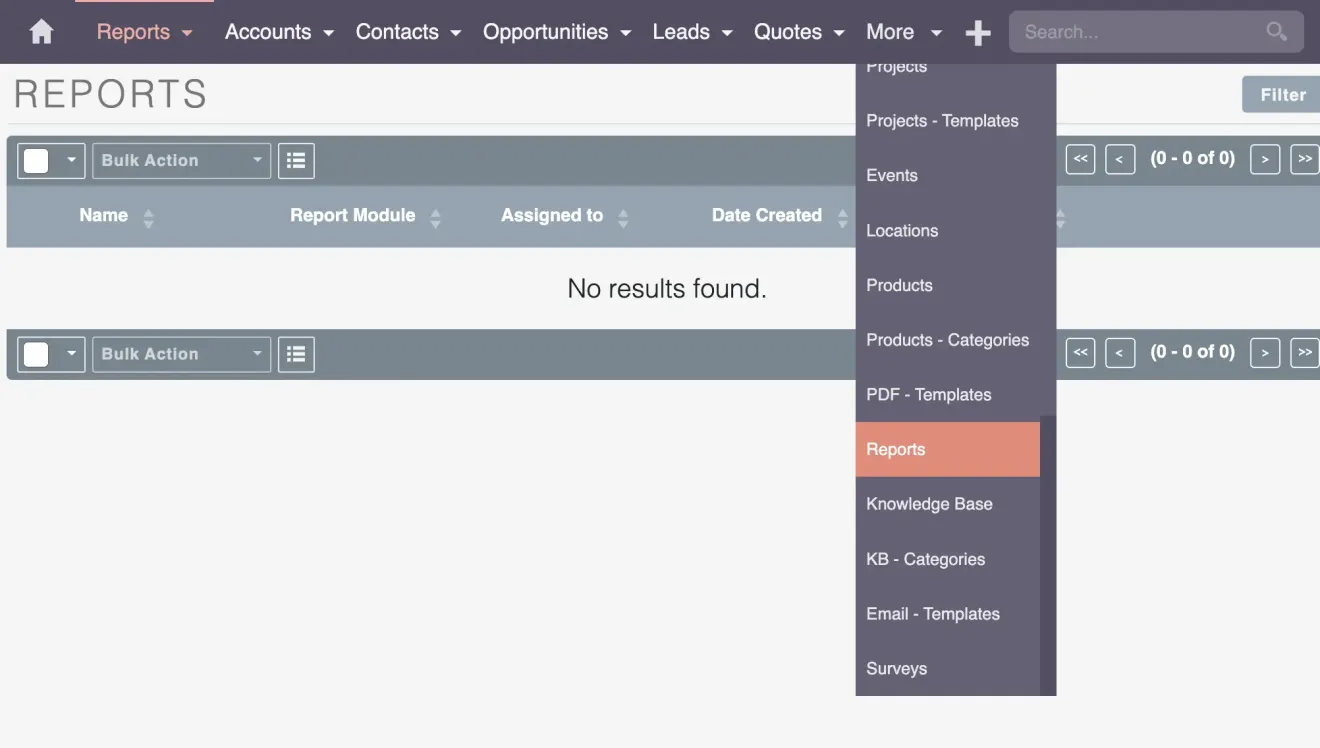
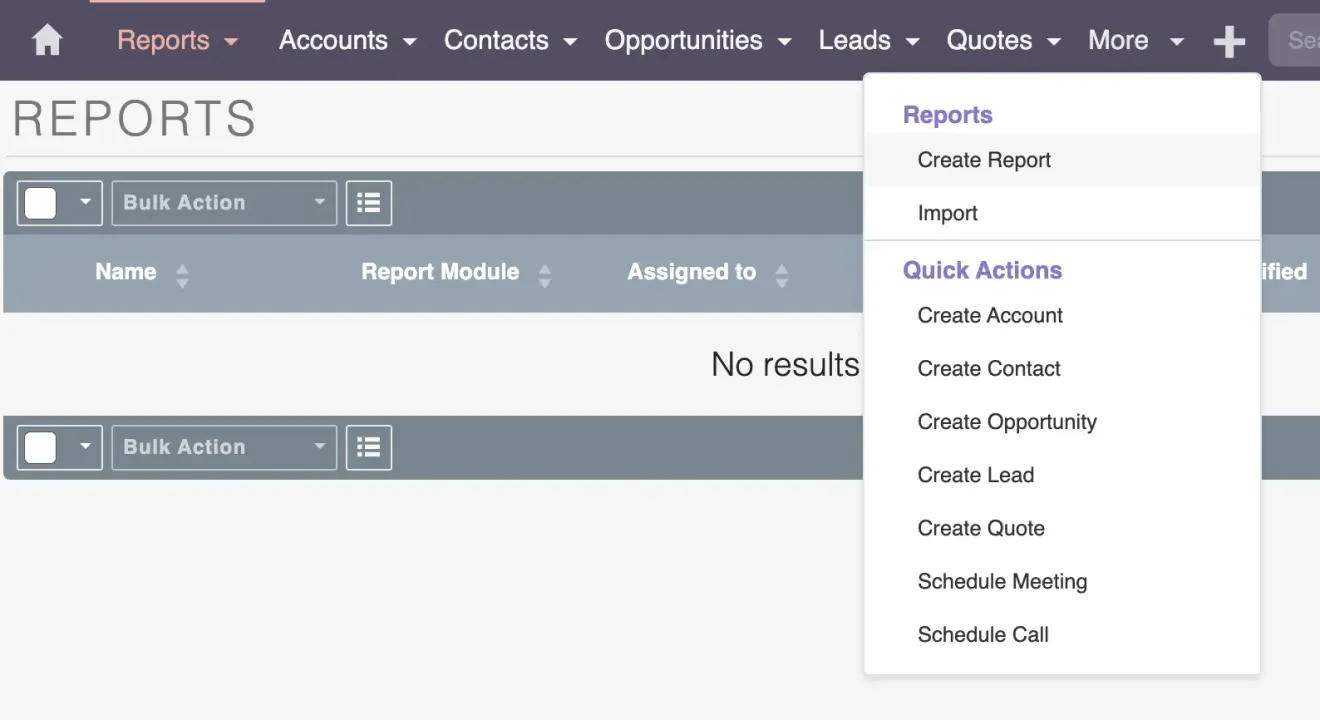
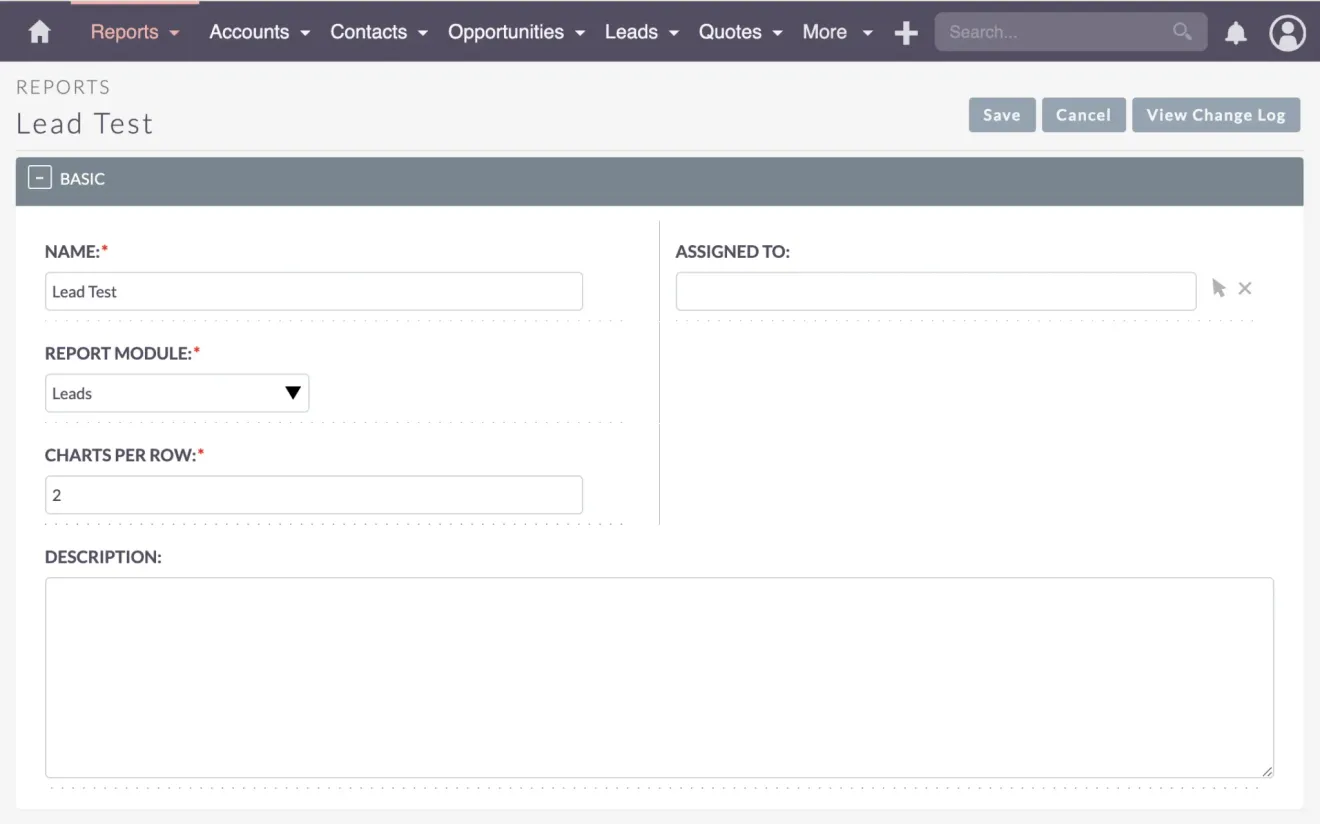
Now, let’s create a report. Add a new report and fill up the fields.
- Name – Give it a name, like “Lead Test.” Think about what you want to accomplish.
- Assigned to – Consider assigning it to specific team members if multiple departments are working on reports. This helps organize permissions (check out my video on SuiteCRM Roles and Permissions). Always configure settings carefully, especially if you want to restrict access based on departments.
- Report Module – Select the module you’re reporting on. In this case, it’s Leads.
- Charts per row – If you want to add charts to your reports, you can customize how many charts appear on each row. But if you don’t need charts, you can just stick with the default setting.
Now, onto the critical area. You’ll see a Module Tree on the left, but remember to select the module you’re reporting on (in this case, Leads) to choose relevant fields.
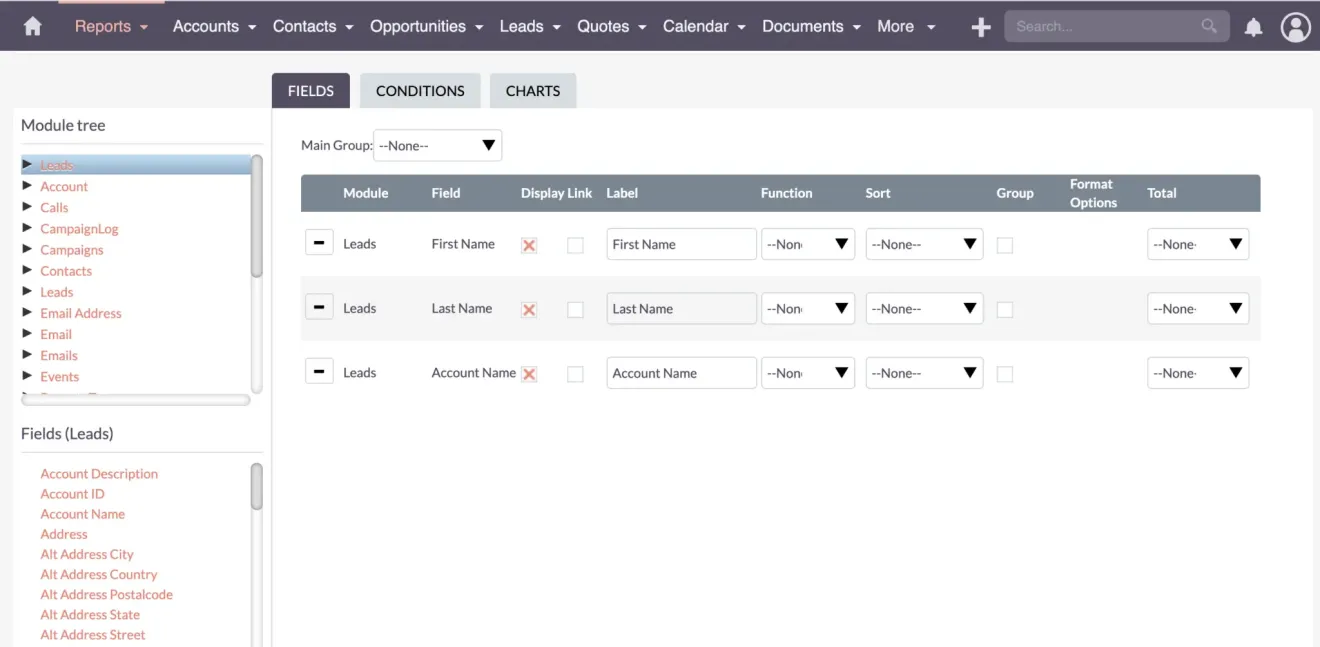
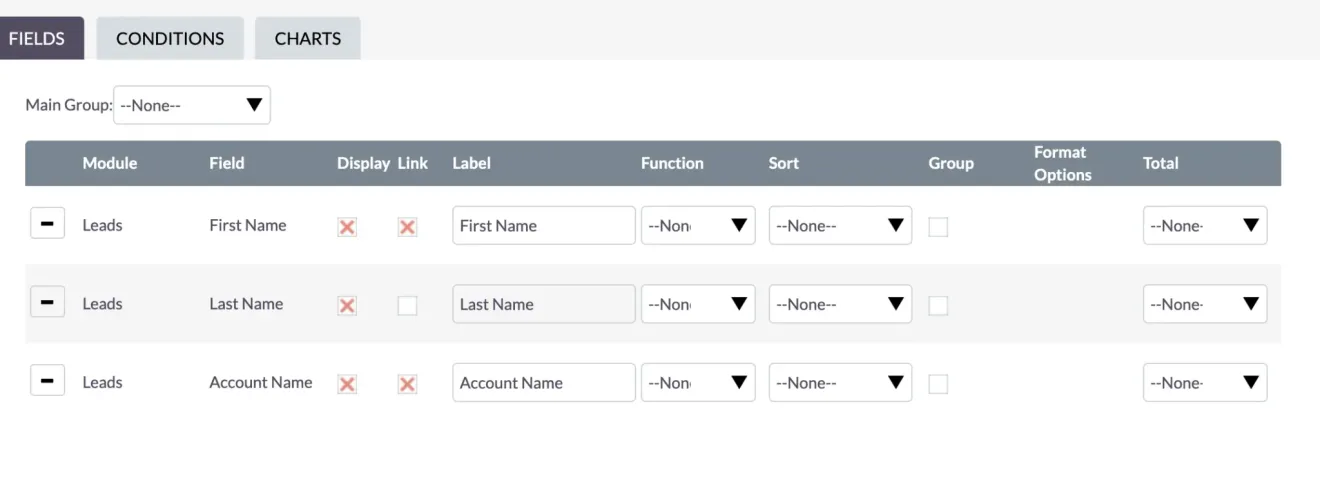
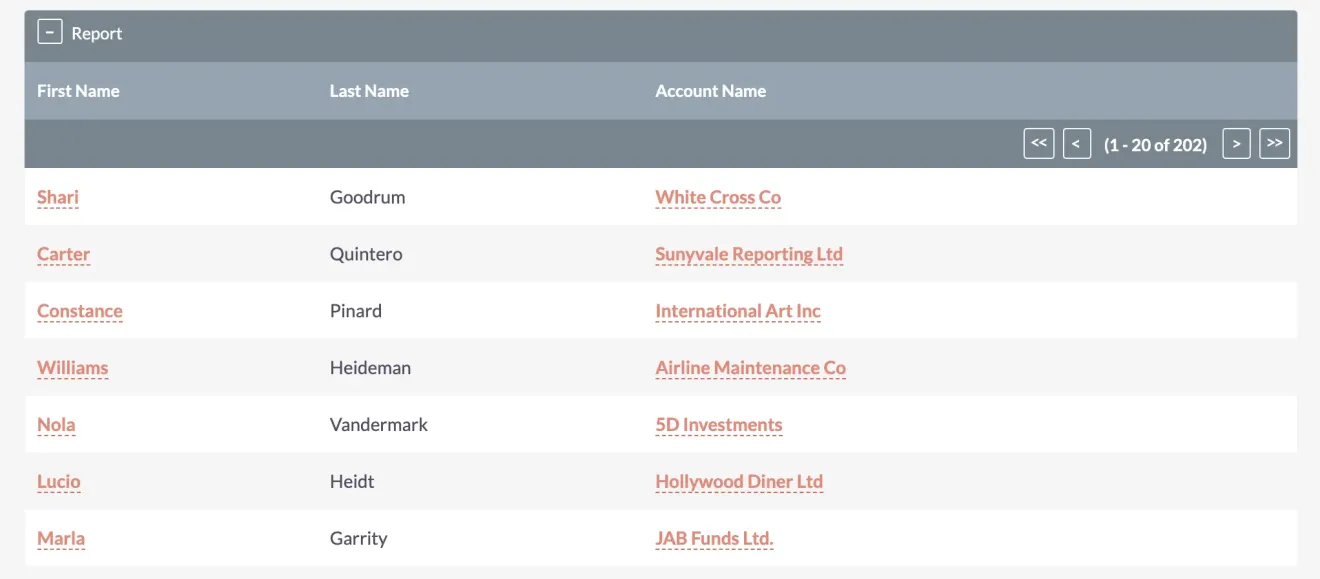
Start by selecting fields like First Name, Last Name, and Account Name. Save your report to preview the outcome. You can further edit columns, display options, and even link data records for quick validation.
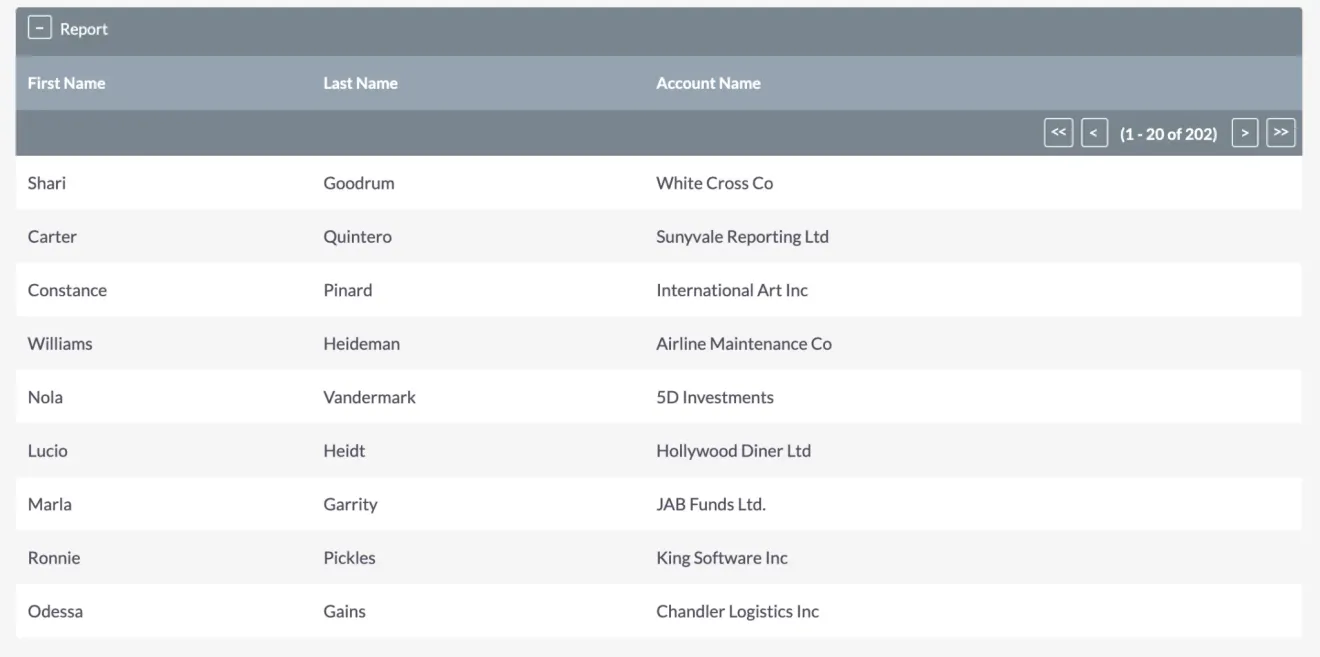
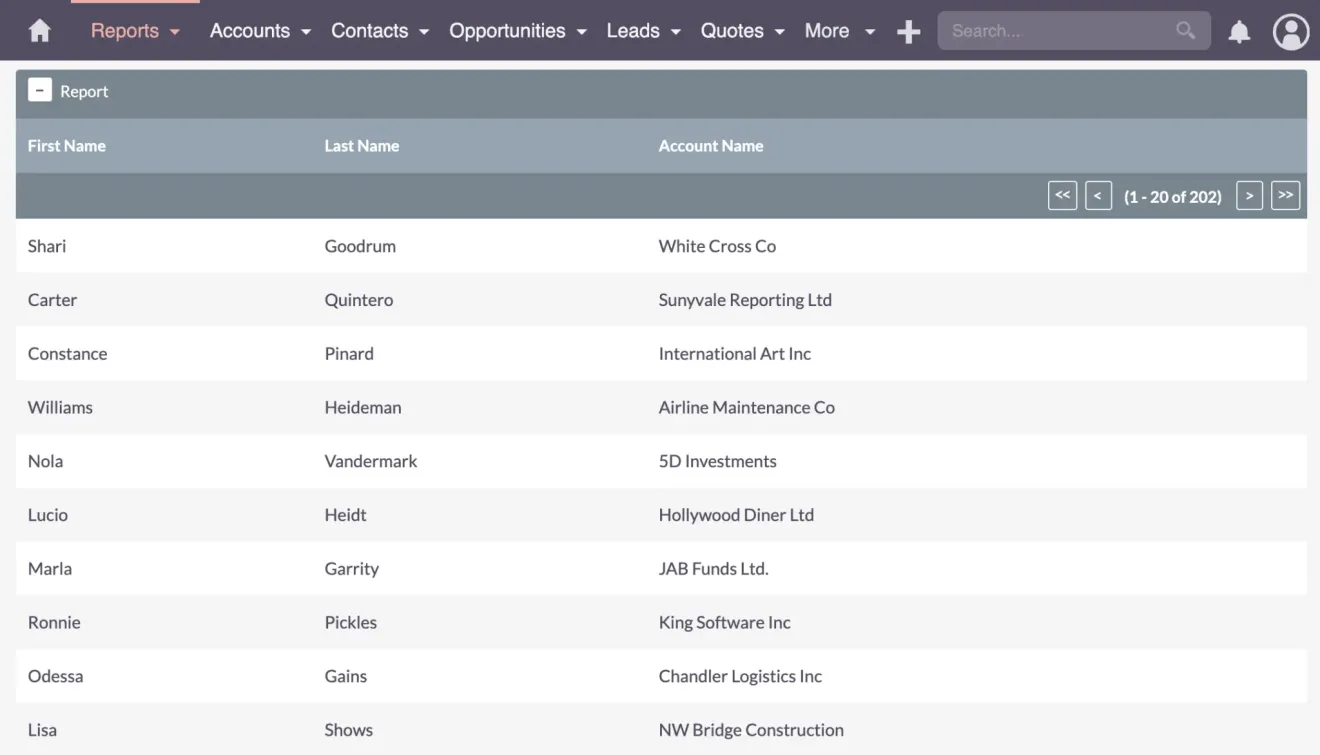
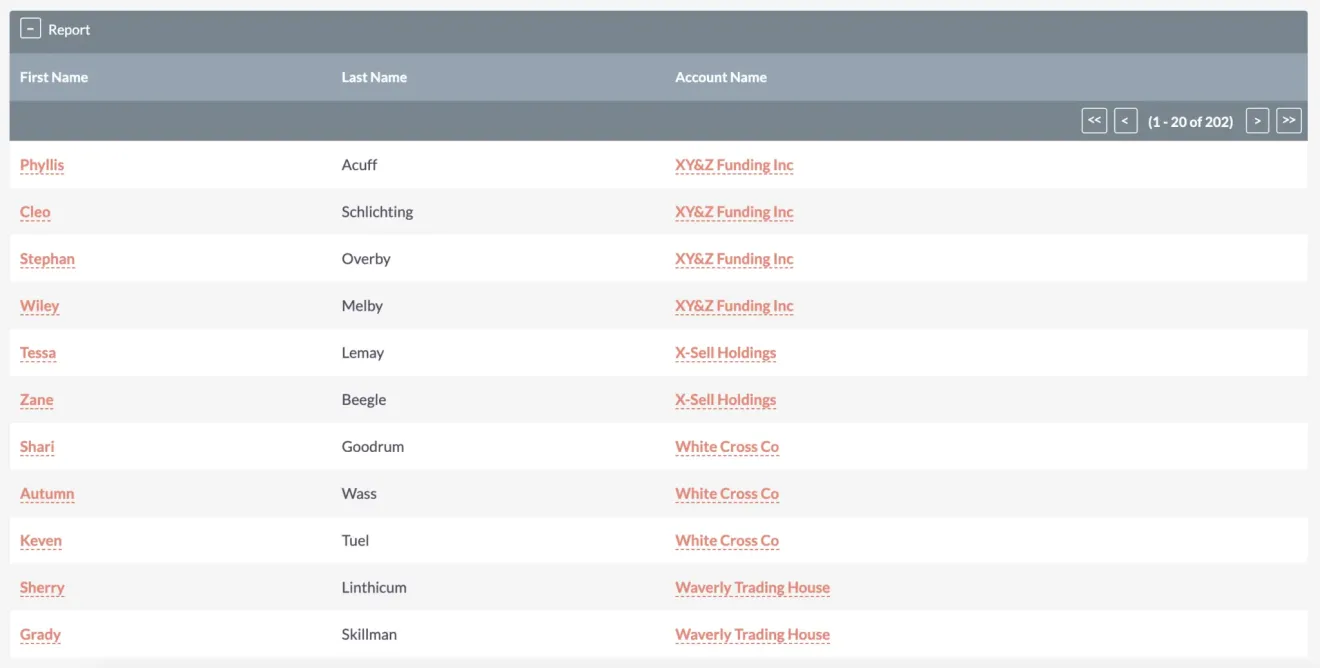
Let’s check the data in the list view, where we observe the number of entries. This count corresponds with what we see in the Leads module, maintaining consistency. The displayed information includes first names, last names, and account names.
Customize Your Report
Customizing Your Report with Fields
Now, let’s go back and edit the “Lead Test” report to explore further customization options.
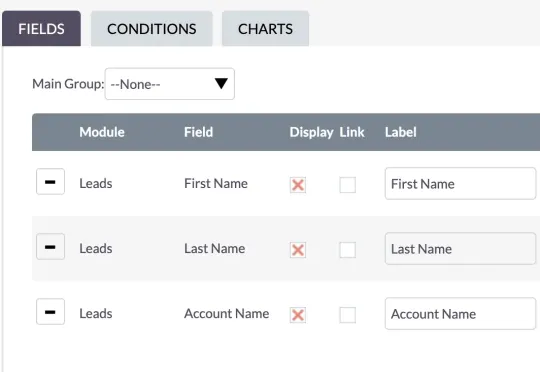
What you’ll be doing here is essentially choosing what information you want to display and how you want it displayed. First up, let’s check out individual columns.
Display
Want to display or hide specific columns? No problem! For now, let’s display them all. We can always customize it later.
Link
Now, let’s add some functionality. Activate linking for “First Name” and “Account Name,” then save.
Clicking on a record will instantly open up the lead details – super handy for complex reports!
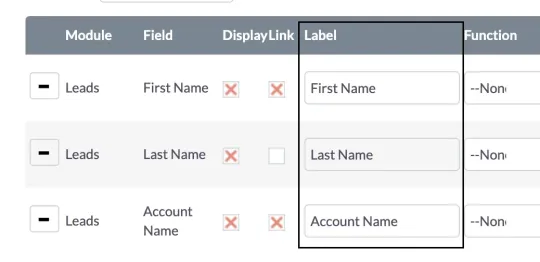
Label
This is what your column will be called on the report; choose a name that makes sense to you.
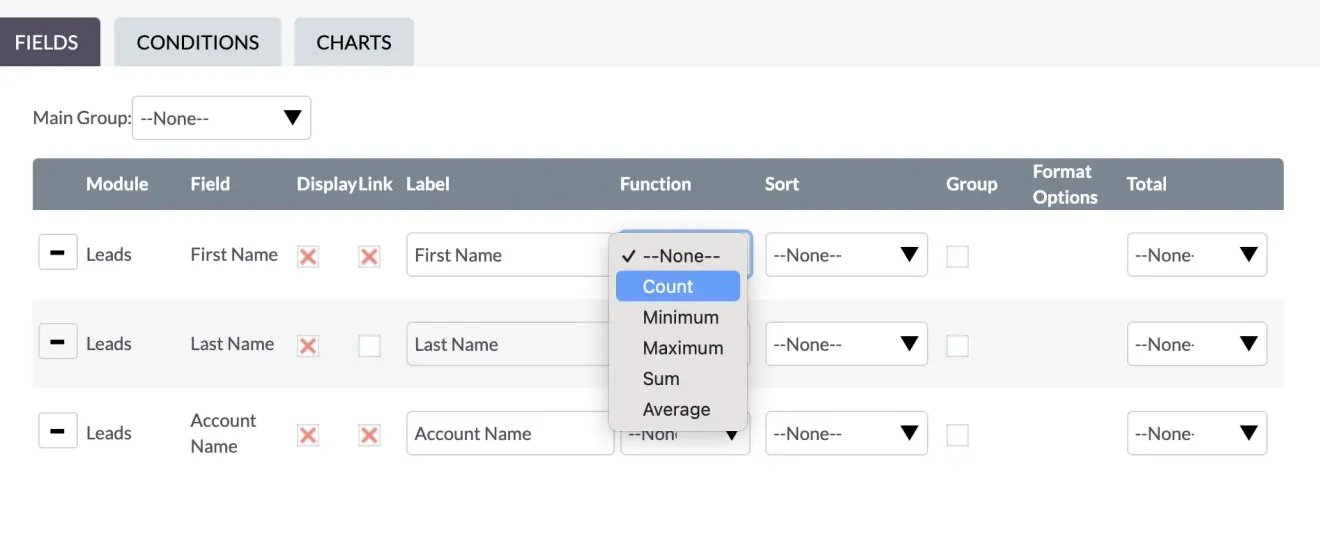
Function
SuiteCRM offers functions for data analysis, like count, minimum, maximum, sum, and average. Use them for a quick and easy summary of your data. For example, want to know the total count of entries? Just use the count function.
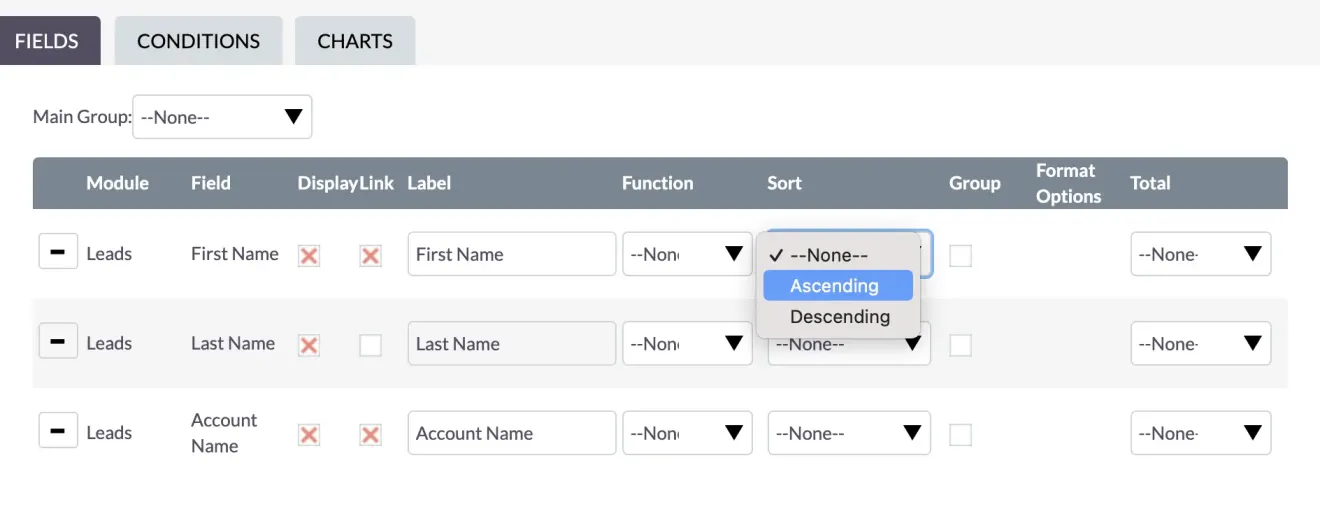
Sort
Sorting data involves ascending and descending order. Whether you want it from lowest to highest or the other way around, sorting your data is a breeze in SuiteCRM.
Group
Categorize your data with grouping. Just a heads up – be mindful of inconsistent data entries and different spellings, especially when dealing with things like country names.
Totals
Totals provide a convenient way to display a summarized figure at the bottom of your report. For instance, if you’re using the “count” function, the total count will be showcased at the report’s conclusion.
Group and Sort
Playing with Grouping and Sorting
Let’s play around with grouping and sorting in SuiteCRM reports.
Right now, we’re testing out grouping by First Name. If you check the report, you’ll notice the first name column is empty.
Now, let’s attempt a different approach and group by the Account Name and sort it in descending order. The grouping may reveal various leads or entities associated with a specific group.
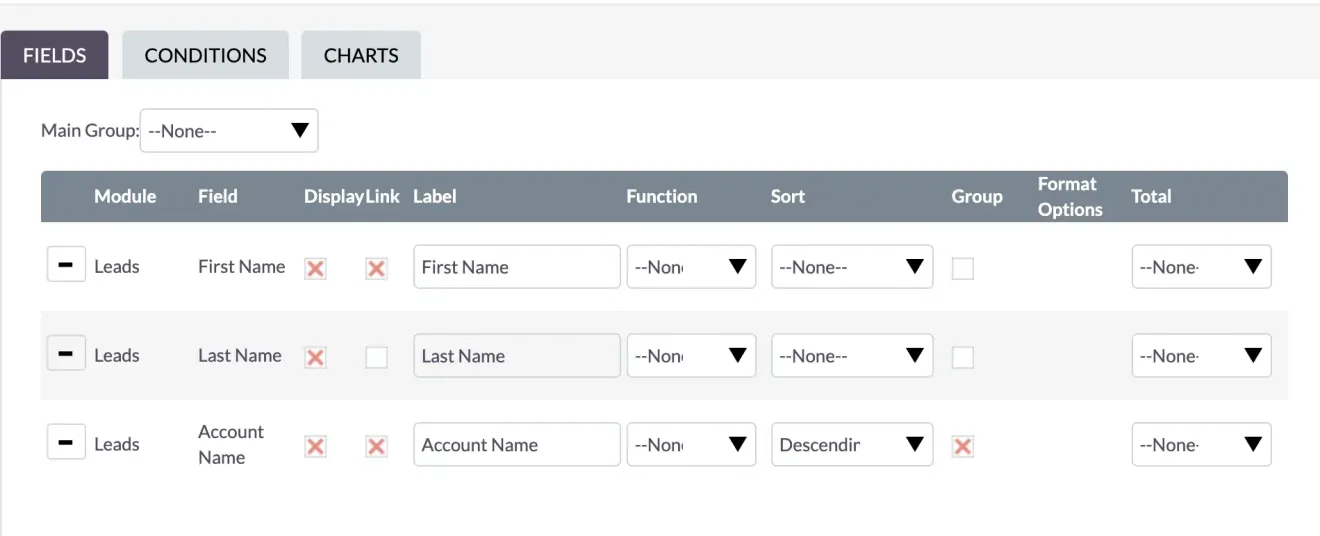
In the demonstrated example, there seems to be a grouping based on the identifier, indicating different leads or entities sharing this common characteristic within the selected group. Grouping allows for efficient organization and analysis of data, providing valuable insights into your SuiteCRM reports.
Quick tip – when grouping data, especially by country, city, etc., ensure consistency in your naming conventions. For instance, if you’re grouping by country and have entries for the US, USA, United States of America, and United States, you’ll end up with four distinct groups.

Getting your data right is the secret sauce for spot-on reports! Careful data organization and validation are crucial to accurate reporting, as different text inputs for the same data can skew results.
Bastian Hammer
Totals and Functions
Understanding Totals and Functions
Now, let’s play with totals and functions a bit.
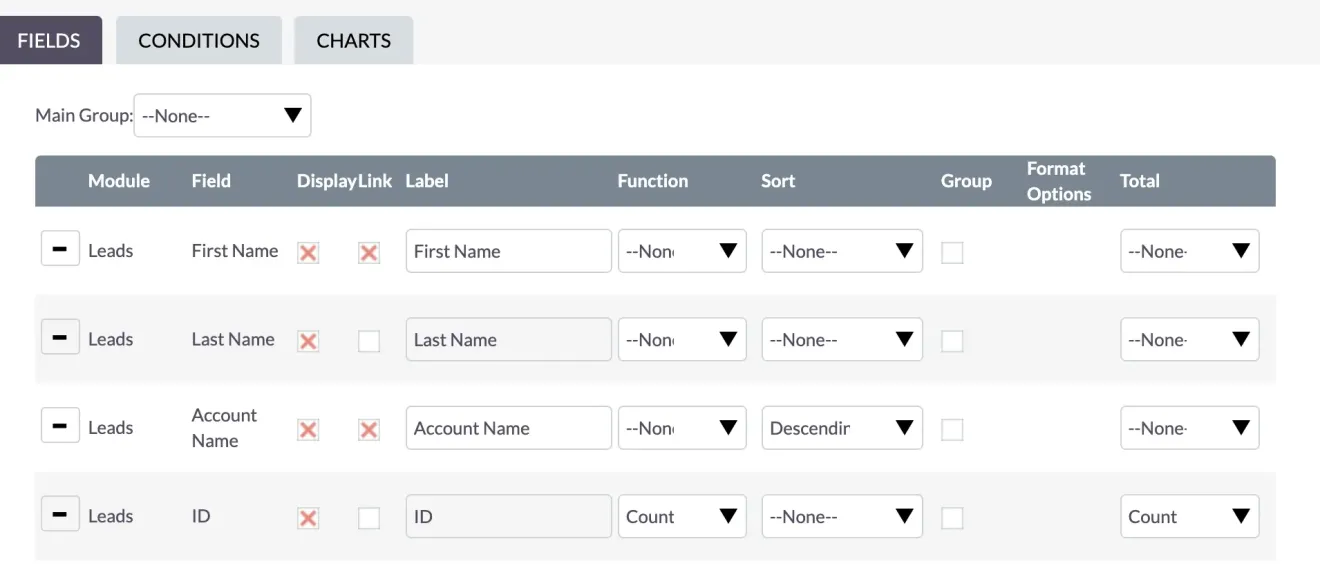
Take the ID field, try the COUNT function, and see how it works. In our example, it’s tallying everything correctly. In this report, the count display is 1, which is technically correct.
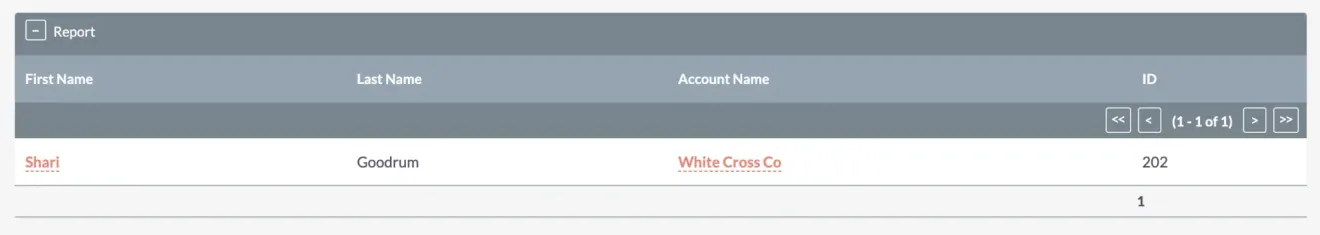
However, be cautious – applying functions without careful data scrutiny can lead to skewed results. Always double-check your data before using functions to avoid unintended grouping or summarization.
Applying the COUNT function to the ID field without checking the data can give accurate but potentially misleading results. Let’s remove it for now. Accuracy in reporting hinges on thorough data validation before using functions.
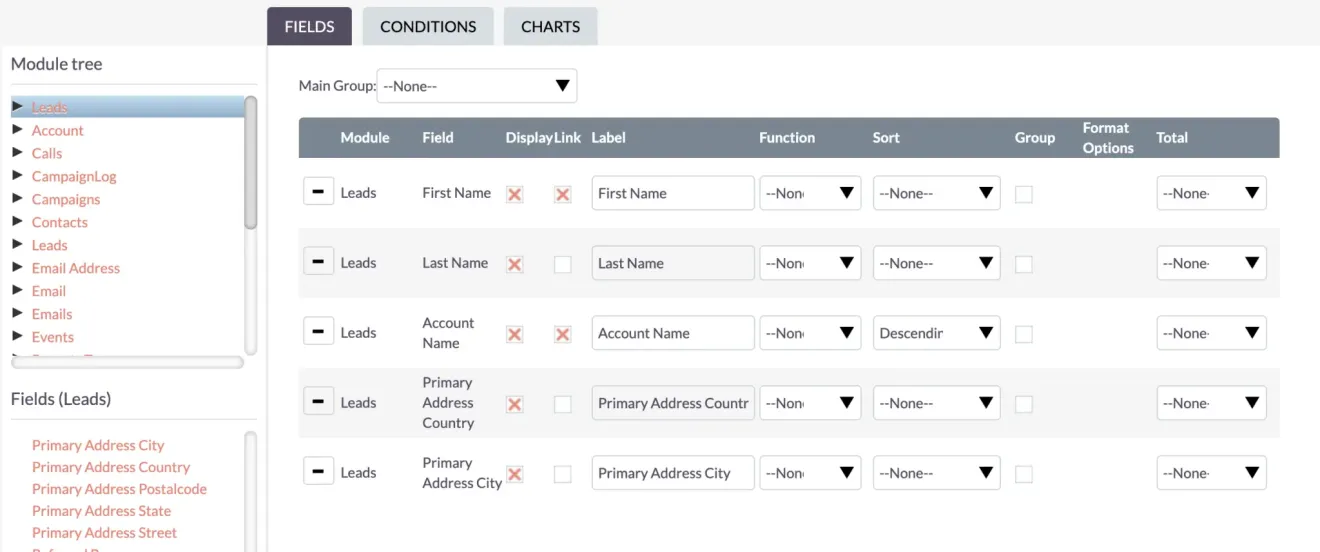
Time to spruce up the report! Let’s add more details, focusing on geography this time. Display the Primary Address Country and Primary Address City fields for a deeper level of analysis.
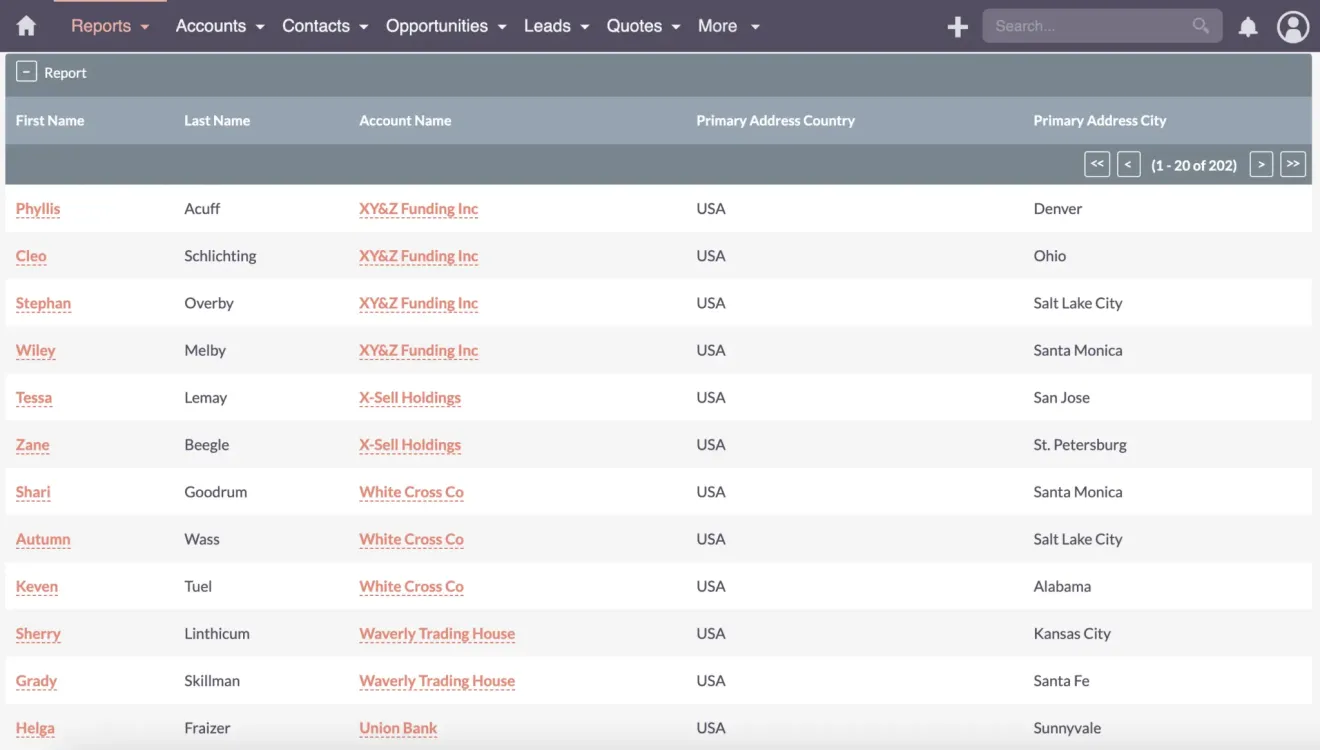
After saving these additions, the data displays seamlessly in the report. Now, let’s take it a step further and apply some conditions to refine our insights.
Conditions
Adding Conditions for Accurate Reporting
Now, let’s talk about conditions in reports. You know, those little details that can make a big difference in your data.
Imagine you’re trying to find all the leads from the US. You’d think searching for “USA” would give you all the results you need, right? Well, not quite. It turns out that searching for “USA” gives you a few results while searching for “United States” gives you a different number of records!
As I mentioned earlier, these are two different countries. So, here’s the tip: be meticulous in keeping your CRM system organized, especially with text fields where people can input various formats. See how to correct those things in Working with Data.
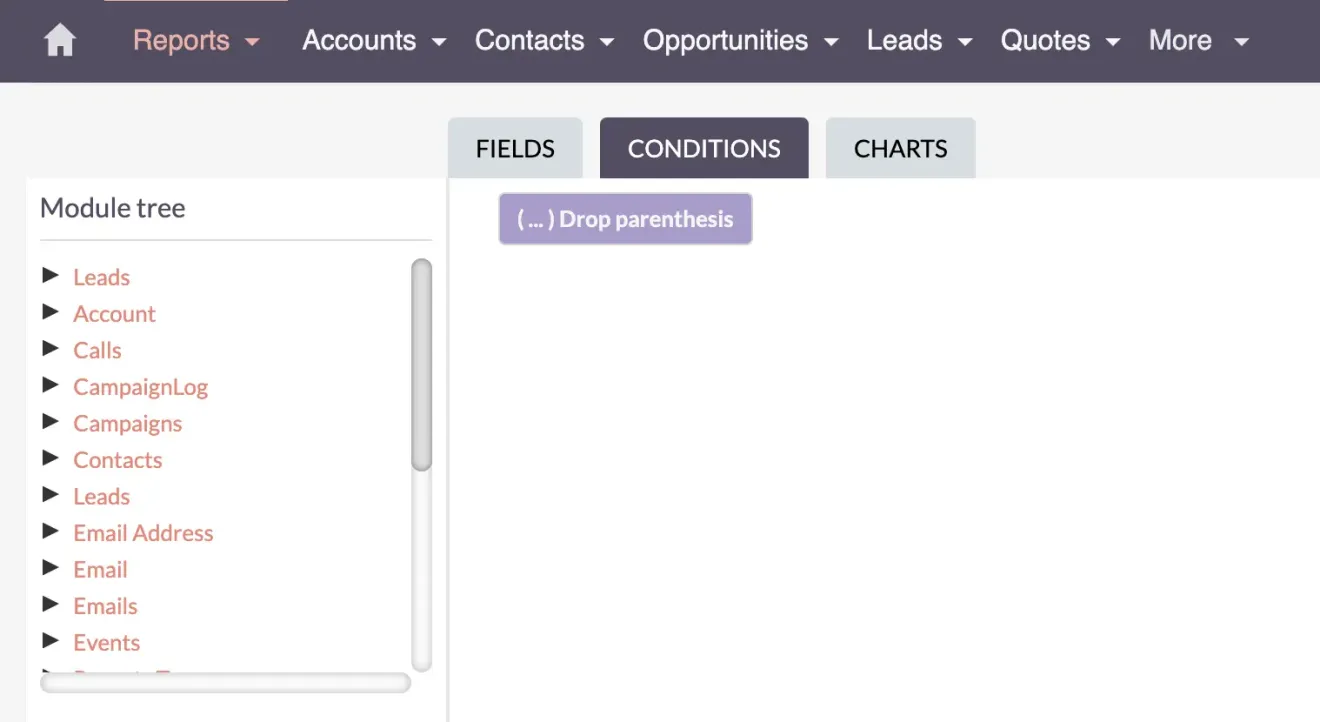
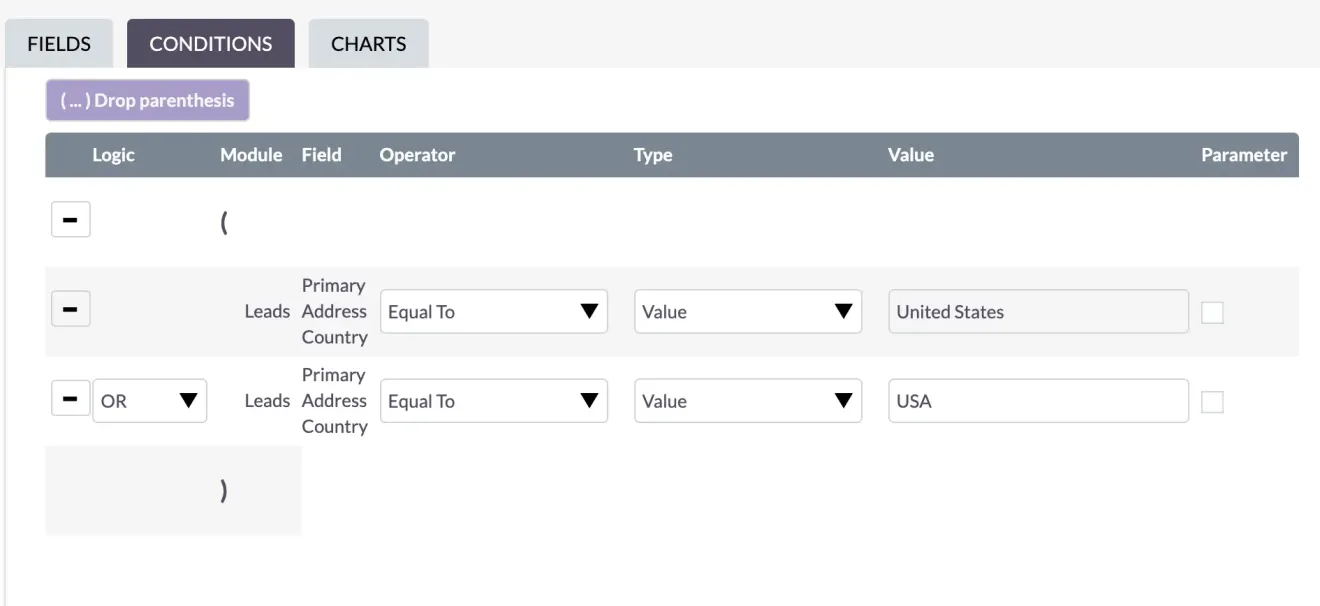
If you need a quick solution for your report, you can use conditions. By adding parentheses and conditions, you can refine your search. For instance, searching for the country in leads and applying the correct logical operator (OR) helps find either “USA” or “United States.” After this adjustment, you’ll get an accurate count of records.
By being super careful with our data entry and using the right field types, we can avoid all this confusion. If you want even more insights on how to improve your data quality, check out my video on SuiteCRM Fields.
Types and Parameters: Tailoring Reports to Your Needs
Types
First off, let’s talk about types. You’ve got a few options to choose from, like using a specific Value, a Field, or even the Current User.
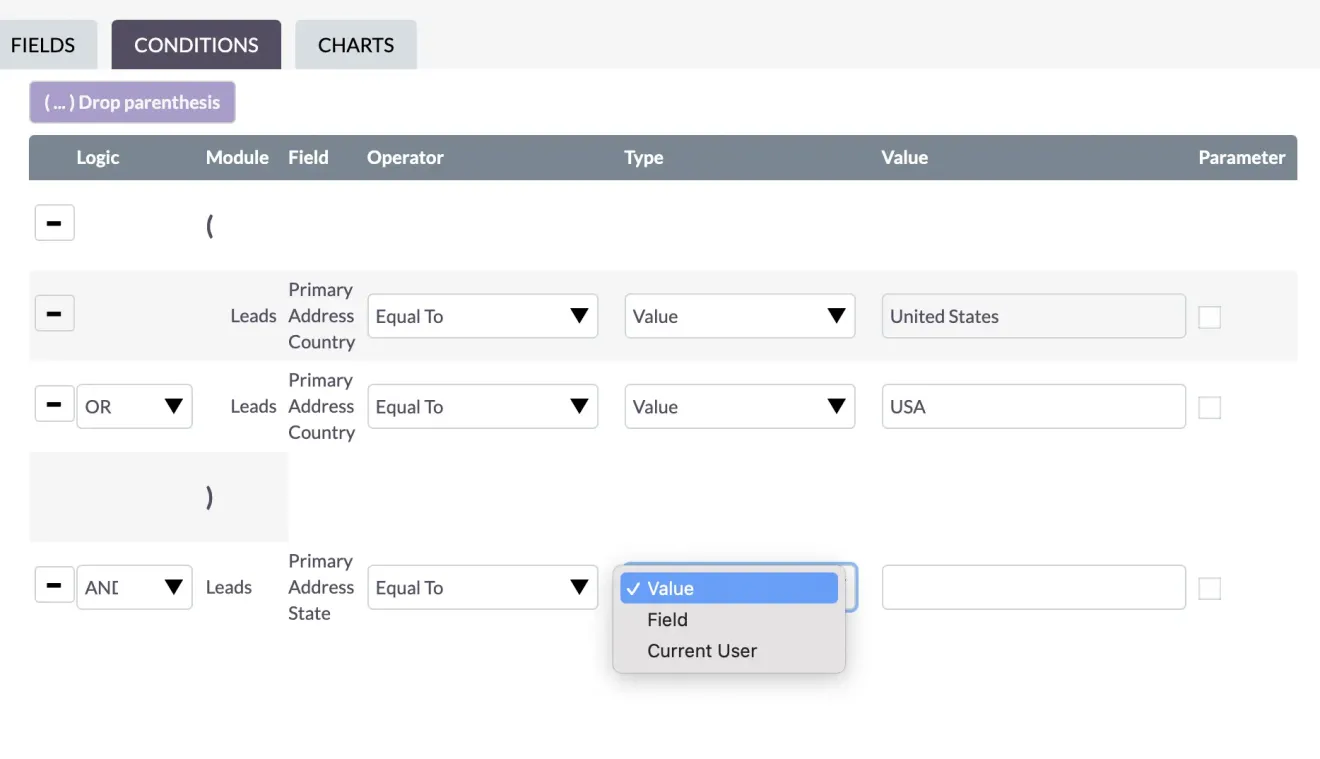
For instance, you can create a report that highlights leads with identical addresses using the Field option. Or, if you want user-centric reports for dashboards or KPIs, it makes sense to use the type Current User. But for now, we’ll keep it simple and stick with the Value.
Parameter
Now, there’s another useful feature within conditions, and it’s called a parameter. This comes in handy, especially if you need to generate a monthly report or track statistics like KPIs regularly. For instance, if you want to focus on leads from California, you’d set the Primary Address State to equal California, and you get results with different cities listed.
I have used this approach in several projects where you just need to change one thing every month, and based on that change, you would get different numbers.
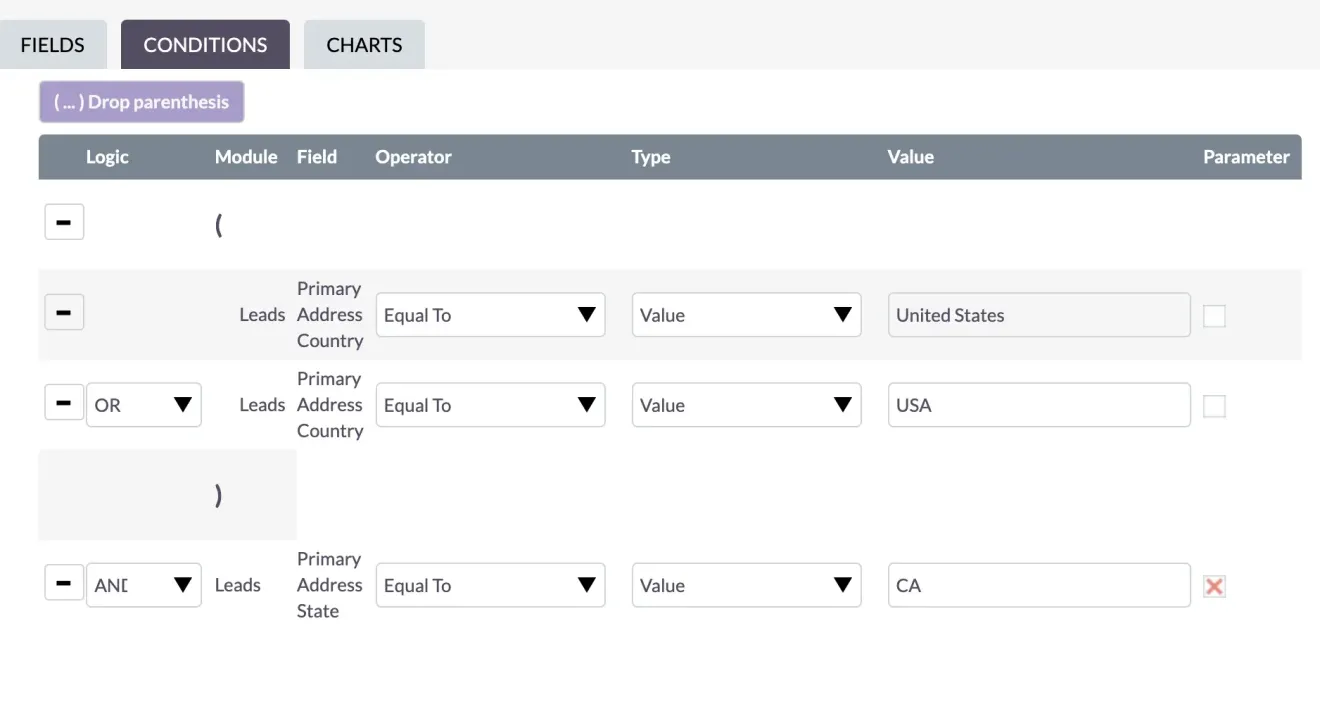
To make this process efficient, just tick the checkbox labeled “parameter.” By doing this, you save it as a parameter, in this case, CA. Now, you can easily reuse the same report and change the parameter to, let’s say, Texas or New York.
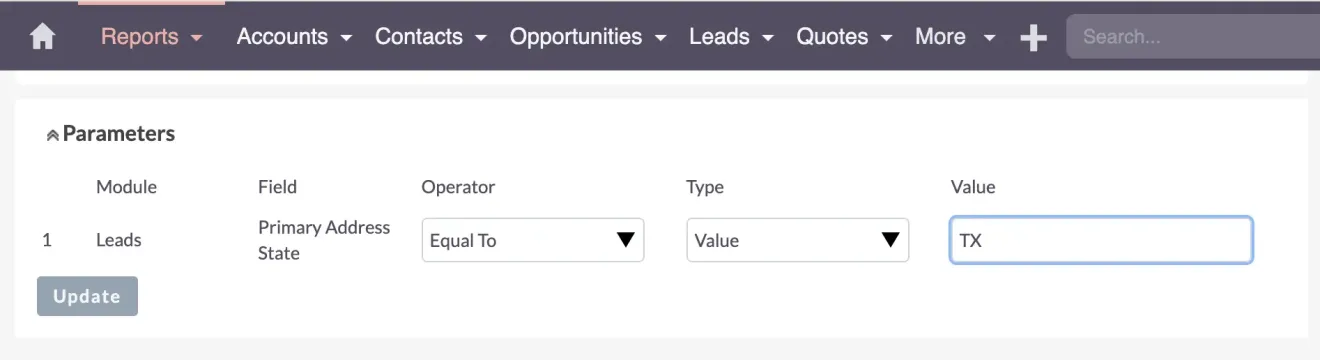
This way, you can effortlessly adapt the report to different criteria without having to edit it repeatedly.
Recap
SuiteCRM Report Basics – Recap and What’s Next
We had a great start to our report-creating journey. We’ve discussed fields, a quick overview of the count, and conditions. We’ve also explored how to use parameters to create dynamic reports that can adapt to changing criteria, like monthly reports.
This concludes the very basics of creating a report. In upcoming videos, we’ll delve deeper into advanced report features, such as grouping, functions, reports spanning multiple modules, and visualization through charts. Stay tuned for more insights!
Remember, creating a report can seem daunting at first, but don’t worry, I’m here to guide you through it. With a little practice and patience, you’ll be creating reports like a pro in no time. If you have any questions or need further clarification, feel free to reach out. I’m always here to help.
Have fun exploring SuiteCRM reports!
